
属实是写工具函数写上瘾了,又写了一个一行代码将坐标轴变为箭头坐标轴的函数,而且可以对其进行随意拖动和缩放(拖动需要先点击那个像手掌的符号):  功能函数的引用非常简单,就只是在最后面加上一行:
arrowAxes()
或者
arrowAxes(ax)
即可,以下给出几个例子:
demo1 基础使用就像上面说的一样,编写好代码后在最后面引用一下工具函数即可:
% arrow axes demo1
% @author:slandarer

t=-pi:.2:2*pi;
stem(t,sin(t),'LineWidth',1.5);

arrowAxes()

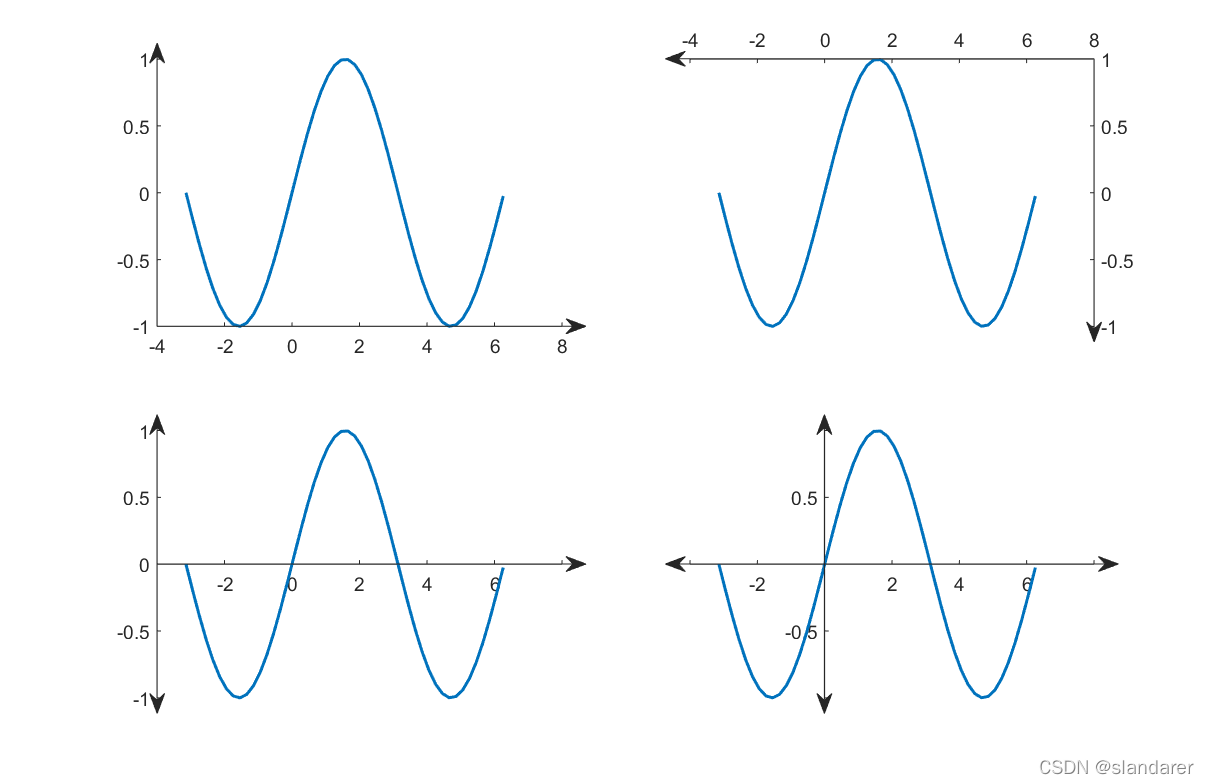
可以调整坐标区域的XAxisLocation属性及YAxisLocation属性来调整坐标轴的方向和位置,总共有九种组合,篇幅问题这里不一一列举,想了解的可以去以下网址瞅瞅:
坐标区的外观和行为 - MATLAB - MathWorks 中国
这里只列举常用的四种:
% arrow axes demo2
% @author:slandarer

t=-pi:.2:2*pi;


% 子图1
ax1=subplot(2,2,1);
plot(t,sin(t),'LineWidth',1.5);
arrowAxes(ax1)

% 子图2
ax2=subplot(2,2,2);
plot(t,sin(t),'LineWidth',1.5);
ax2.XAxisLocation='top';
ax2.YAxisLocation='right';
arrowAxes(ax2)

% 子图3
ax3=subplot(2,2,3);
plot(t,sin(t),'LineWidth',1.5);
ax3.XAxisLocation='origin';
arrowAxes(ax3)

% 子图4
ax4=subplot(2,2,4);
plot(t,sin(t),'LineWidth',1.5);
ax4.XAxisLocation='origin';
ax4.YAxisLocation='origin';
arrowAxes(ax4)
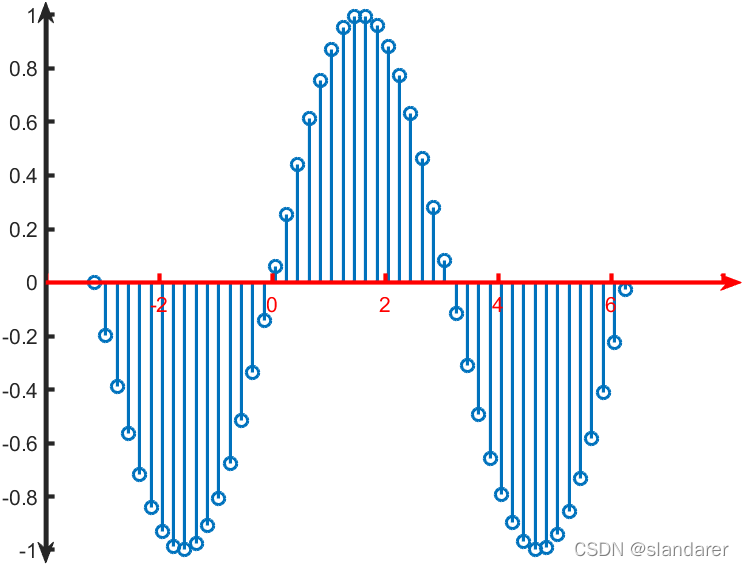
在引用工具函数前调整坐标轴的粗细和颜色,引用工具函数时,工具函数会自动提取坐标轴的属性并赋予箭头坐标轴:
% arrow axes demo3
% @author:slandarer

t=-pi:.2:2*pi;
stem(t,sin(t),'LineWidth',1.5);

% 修改坐标轴属性
ax=gca;
ax.XColor=[1,0,0];
ax.LineWidth=2;
ax.XAxisLocation='origin';

arrowAxes(ax)
不管画多少子图,怎样的轴方向和位置,每个子图都能像如下这样任意调整坐标范围和图像缩放。 

function arrowAxes(ax)
%
% @author: slandarer
% @公众号: slandarer随笔
% @知乎 : hikari
% @CSDN : slandarer
%
% 期待您的关注!!!
help arrowAxes % 若不希望输出[作者信息],请删除这行
if nargin0&ylim(1)0&xlim(1)
关注
打赏
最近更新
- 深拷贝和浅拷贝的区别(重点)
- 【Vue】走进Vue框架世界
- 【云服务器】项目部署—搭建网站—vue电商后台管理系统
- 【React介绍】 一文带你深入React
- 【React】React组件实例的三大属性之state,props,refs(你学废了吗)
- 【脚手架VueCLI】从零开始,创建一个VUE项目
- 【React】深入理解React组件生命周期----图文详解(含代码)
- 【React】DOM的Diffing算法是什么?以及DOM中key的作用----经典面试题
- 【React】1_使用React脚手架创建项目步骤--------详解(含项目结构说明)
- 【React】2_如何使用react脚手架写一个简单的页面?

